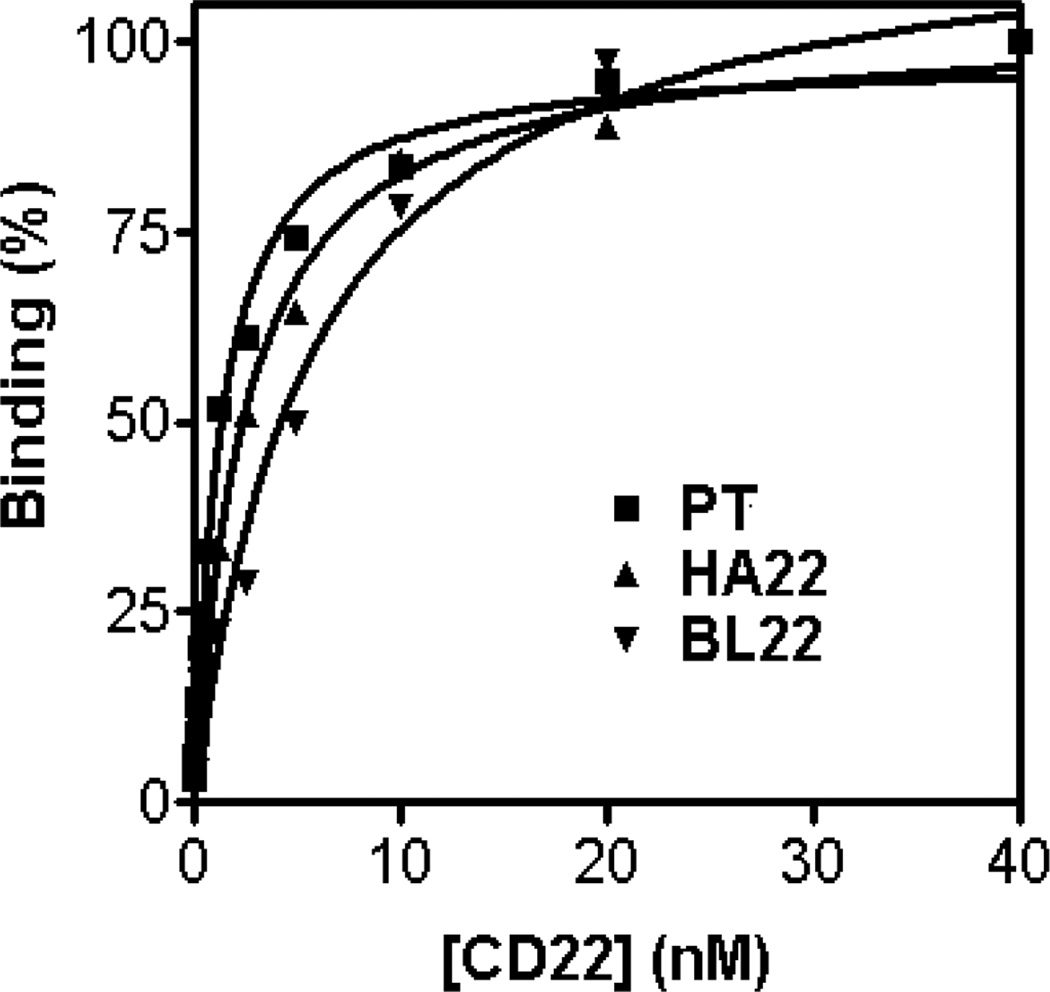
Fig. 5.
Equilibrium binding titration curves to determine dissociation constants, KD. MFI (%) of PE is plotted versus the various concentrations of biotinylated CD22-Fc used to label surface-displayed BL22 (wild-type, KD = 5.8nM, Bmax = 453), HA22 (KD = 2.5nM, Bmax = 293) or mutant PT (KD = 1.2nM, Bmax = 275) antibody. Data are fit with a nonlinear least-squares regression. (Originally published in Proceedings of the National Academy of Sciences 103(25):9637–9642, June 20, 2006); copyright 2006 National Academy of Sciences, U.S.A.

