Fig. 1.

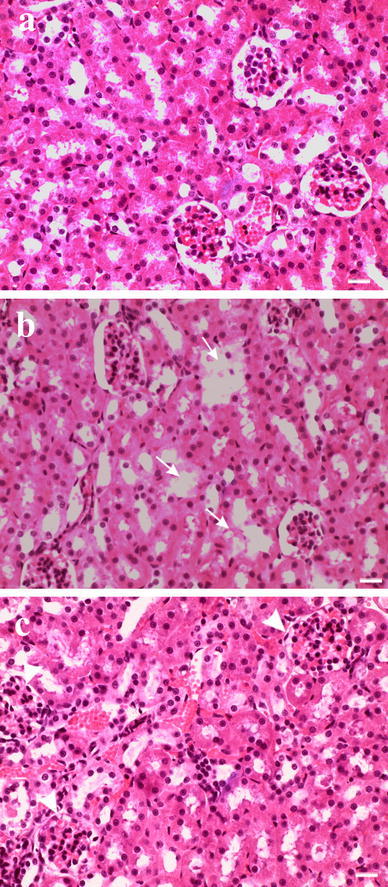
Representative photomicrographs of kidney section from (a) control bank voles, and (b, c) bank voles raised in a group of six and exposed to dietary Cd [b tubule degeneration (arrows), c glomerular swelling (arrowhead)]. Scale bar, 20 μm

Representative photomicrographs of kidney section from (a) control bank voles, and (b, c) bank voles raised in a group of six and exposed to dietary Cd [b tubule degeneration (arrows), c glomerular swelling (arrowhead)]. Scale bar, 20 μm