
Fig. 2.
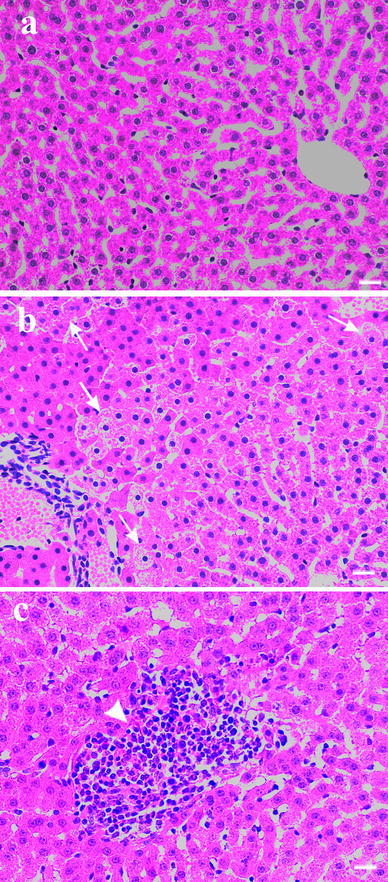
Representative photomicrographs of liver section from (a) control bank voles, and (b, c) bank voles raised in a group of six and exposed to dietary Cd [b hepatocyte swelling (arrows), c leukocyte infiltration (arrowhead)]. Scale bar, 20 μm
Official websites use .gov
A
.gov website belongs to an official
government organization in the United States.
Secure .gov websites use HTTPS
A lock (
) or https:// means you've safely
connected to the .gov website. Share sensitive
information only on official, secure websites.
Representative photomicrographs of liver section from (a) control bank voles, and (b, c) bank voles raised in a group of six and exposed to dietary Cd [b hepatocyte swelling (arrows), c leukocyte infiltration (arrowhead)]. Scale bar, 20 μm