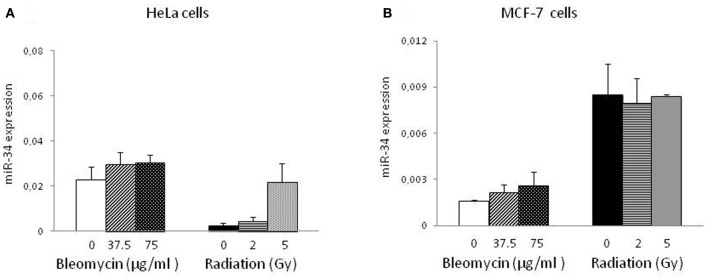
Figure 2.
miR-34 expression in HeLa and MCF-7 cells. miR-34 levels were measured by quantitative PCR in HeLa (A) and MCF-7 (B) cells exposed to genotoxic stress. Results of three-independent cell culture experiments were evaluated to calculate the average value of relative gene expression. Each column represents mean + S.E.

