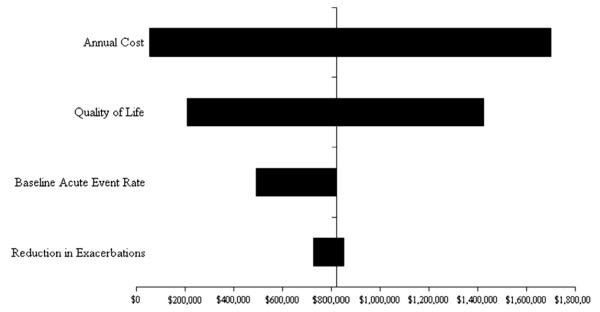
FIG 1.
Sensitivity analysis. This tornado diagram summarizes a series of 1-way sensitivity analyses. Each horizontal bar represents a given model parameter. The vertical axis represents the base-case scenario, as listed in Table II. The length and position of each horizontal bar represents the range of cost-effectiveness outcomes produced by varying that specific parameter over its plausible range, also listed in Table II.

