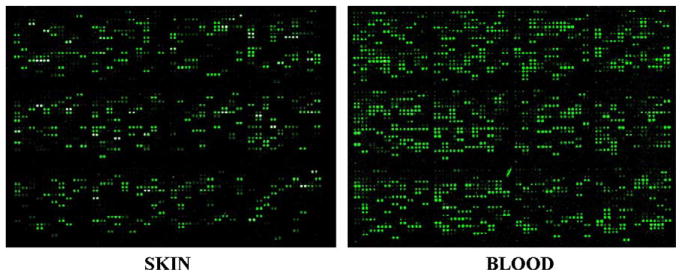
Fig. 4.
Dolphin skin cell RNA hybridization to a bottlenose dolphin blood microarray. Microarray hybridizations of RNA samples from non-treated bottlenose dolphin skin cells (left) versus bottlenose dolphin blood samples (right). One subarray (of 48 total) from the microarray chip is pictured. Fluorescent spots indicate an EST present on the array that hybridized to a gene expressed within the sample. The degree of fluorescence is directly proportional to expression of the gene.

