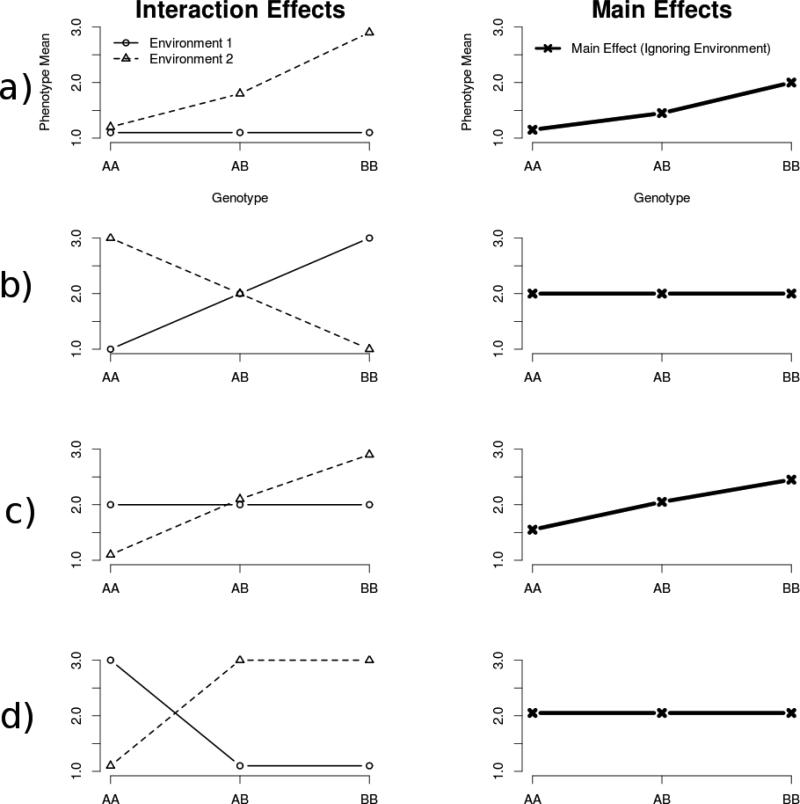
Figure 3.
Association between GxE interaction effects and G main effects. Graphs are organized into rows. The left-hand graph in each row is an example GxE interaction; on the right is the corresponding main effect (assuming the environmental exposure was 50:50 in this sample). The GxE effect observed in row (a), similar to that found in (Caspi, et al., 2003), also shows a main effect when environment is ignored. The effect in row (a) would also show unequal variances across genotypes due to the increasing mean separation between environments as we move from the AA genotype to the BB genotype. The effect in row (b) shows an interaction but no main effect. Row (b) would show unequal variances across genotypes. Row (c), although similar to row (b) would show an interaction, a main effect, and unequal variances. Row (d) is unique in that the effect there would show an interaction, but would demonstrate neither a main effect nor unequal variances.

