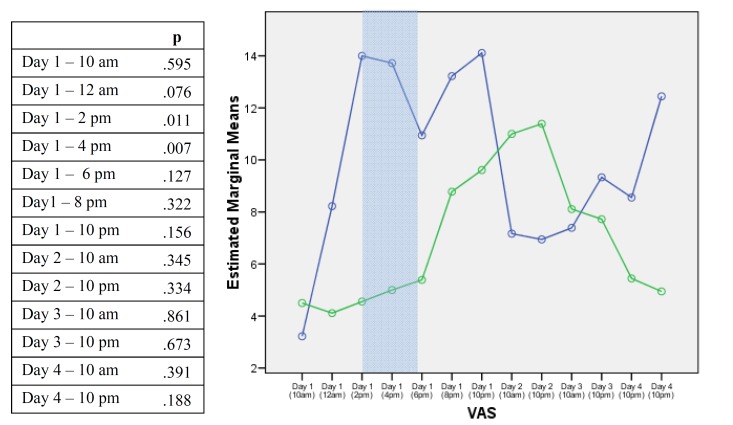
Figure 3.
P values corresponding to differences between visual analogue scale scores with both anesthetic solutions at different times. The blue line corresponds to articaine and the green line to bupivacaine. Differences were statistically significant on day 1 at 2:00 pm and 4:00 pm (shadowed cells).

