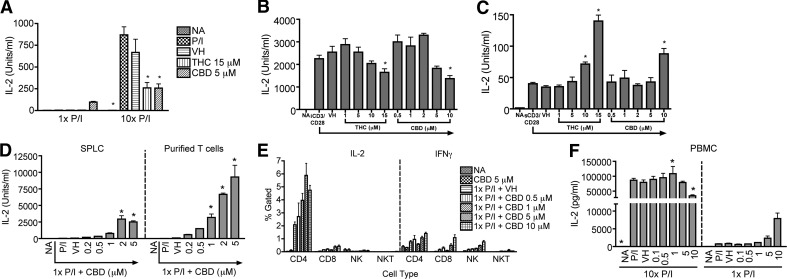
Figure 4. Differential effects of cannabinoids on IL-2 production from different populations.
(A) B6C3F1 splenocytes (8×10⁵ cells/well) were treated with THC (15 μM), CBD (5 μM), or VH (0.1% ethanol) for 30 min and then activated with P/I (10× P/I 40 nM/0.5 μM, 10× P/I; or 1× P/I 4 nM/0.05 μM, 1× P/I) for 18–24 h. (B and C) B6C3F1 splenocytes (8×10⁵ cells/well) were treated with THC or CBD at the indicated concentrations for 30 min and then activated with iCD3/CD28 (B) or sCD3/CD28 (C) for 2 days. (D) B6C3F1 splenocytes (SPLC) or T cells purified from the splenocytes were treated with 0.2–5 μM CBD for 30 min and then activated with 1× P/I for 48 h. (E) B6C3F1 splenocytes (8×10⁵ cells/well) were treated with 0.5–10 μM CBD for 30 min, followed by activation with 1× P/I for 18–24 h. Cells were also treated with Brefeldin A, 4 h prior to harvest. Cells were stained for viability and extracellular markers, CD4, CD8, CD3, and CD49b, as well as intracellular IL-2 and IFN-γ. NK = CD49b+; NKT = CD3+CD49b+. (F) PBMCs were enriched from human leukocyte packs by density gradient centrifugation. PBMCs (2×10⁶ cells/well) were treated with 0.1–10 μM CBD for 30 min and then activated with 1× or 10× P/I for 18–24 h. (A–D and F) IL-2 in the supernatant was quantified by ELISA. Data are presented as the mean units/ml ± se of triplicate cultures. *P < 0.05 as compared with respective VH. (A–F) Data are representative of at least three separate experiments.

