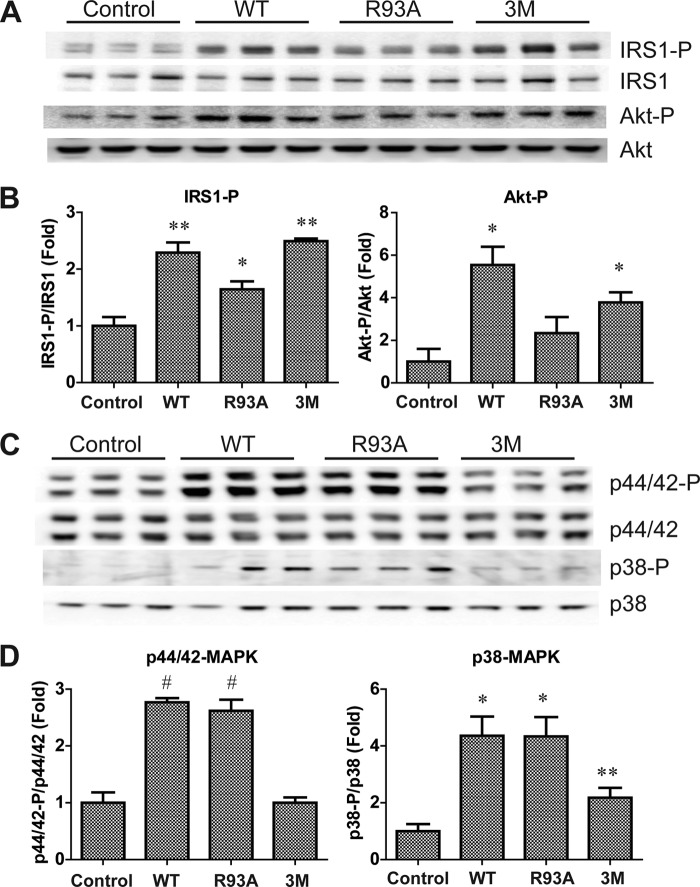
FIGURE 6.
fCTRP12 and gCTRP12 preferentially activate Akt or MAPK signaling in H4IIE hepatocytes. A, immunoblot analysis of IRS1(Tyr612) and Akt (Thr308) phosphorylation in H4IIE hepatocytes stimulated with vehicle control or 10 μg/ml recombinant CTRP12 for 15 min. Blots were also probed for total IRS1 and Akt protein. B, quantification of phosphorylation as shown in A, normalized to total IRS1 and Akt protein, respectively. C, immunoblot analysis of p44/42 MAPK (Thr202/Tyr204) and p38 MAPK (Thr180/Tyr182) phosphorylation in H4IIE cells stimulated with vehicle control or 10 μg/ml CTRP12 for 15 min. D, quantification of phosphorylation as shown in C, normalized to their respective total protein. *, p < 0.05; **, p < 0.01; #, p < 0.001 (n = 3). Error bars, S.E.

