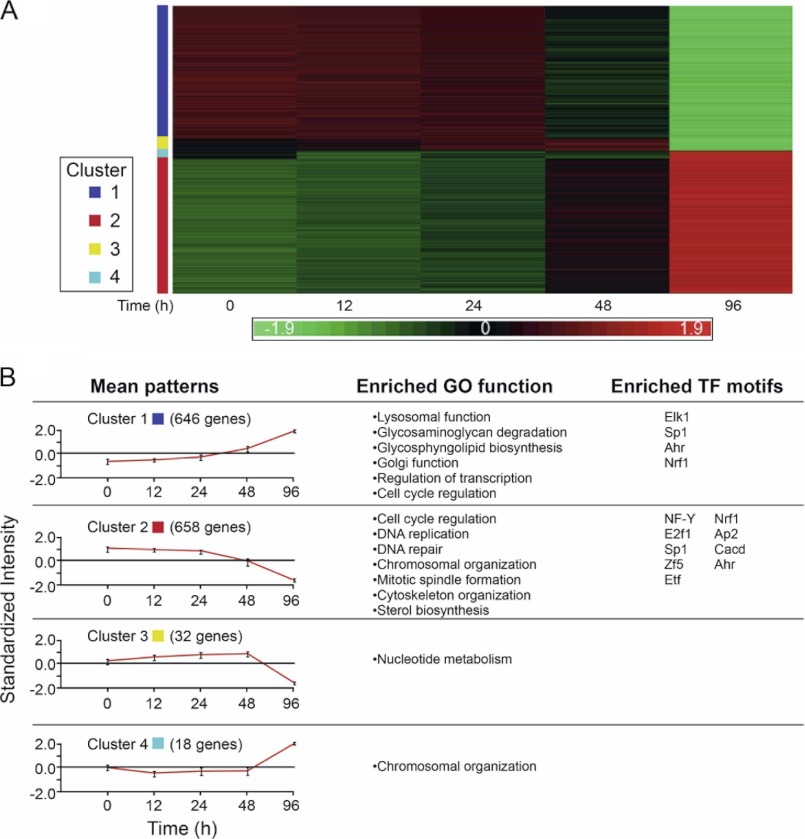
FIGURE 2.
Patterns of gene expression accompanying growth inhibition during polyamine depletion. A, heat map of gene expression patterns. The clusters were calculated by the Click algorithm (EXPANDER suite). Each column represents a single time point during the polyamine depletion process, and each row represents one gene across the different time points. Up-regulated genes are marked in red and down-regulated in green. The intensity values are standardized, and the scale is in standard deviation units. B, mean patterns, mean expression pattern of four clusters; GO function, gene ontology functional analysis of each cluster (DAVID), only significantly enriched functions are shown; TF motifs, significantly enriched transcription factor motifs for each cluster are calculated using the PRIMA algorithm (EXPANDER suite).

