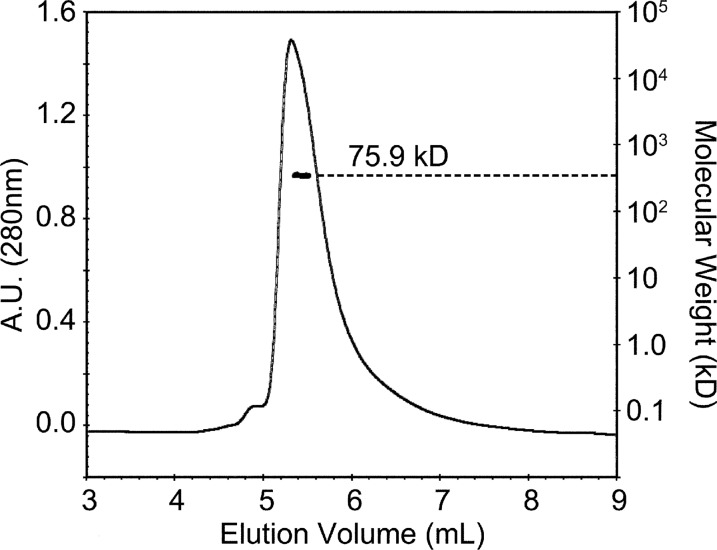
FIGURE 1.
Dimeric EcYqjG in solution. Elution profile for EcYqjG was monitored with multiangle laser light scattering (2 mg ml−1) shown as molecular mass (kDa) versus elution volume (ml). The solid line represents changes in absorption at 280 nm. The thick black cluster in the middle of the peaks indicates the calculated molecular mass. A.U., absorbance units.

