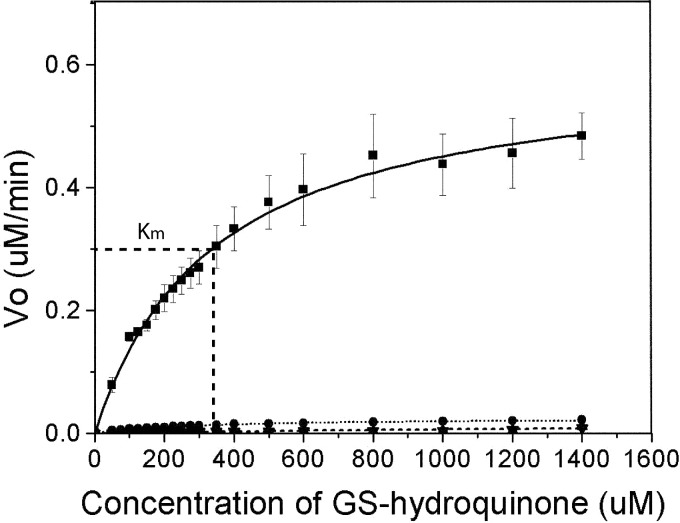
FIGURE 5.
Michaelis-Menten curve for wild type and mutants of EcYqjG. Plot of reaction velocity (y axis) with differing GS-HQ concentrations (x axis). Km (341 ± 18.9 μm) is indicated on the wild-type curve (dashed line). Kinetic curves for wild type (■), Y195F (▴), Y253F (▾), and Y296F (●) are displayed. Y195F and Y253F have approximately equivalent reaction rates, which lead overlap of the curves.

