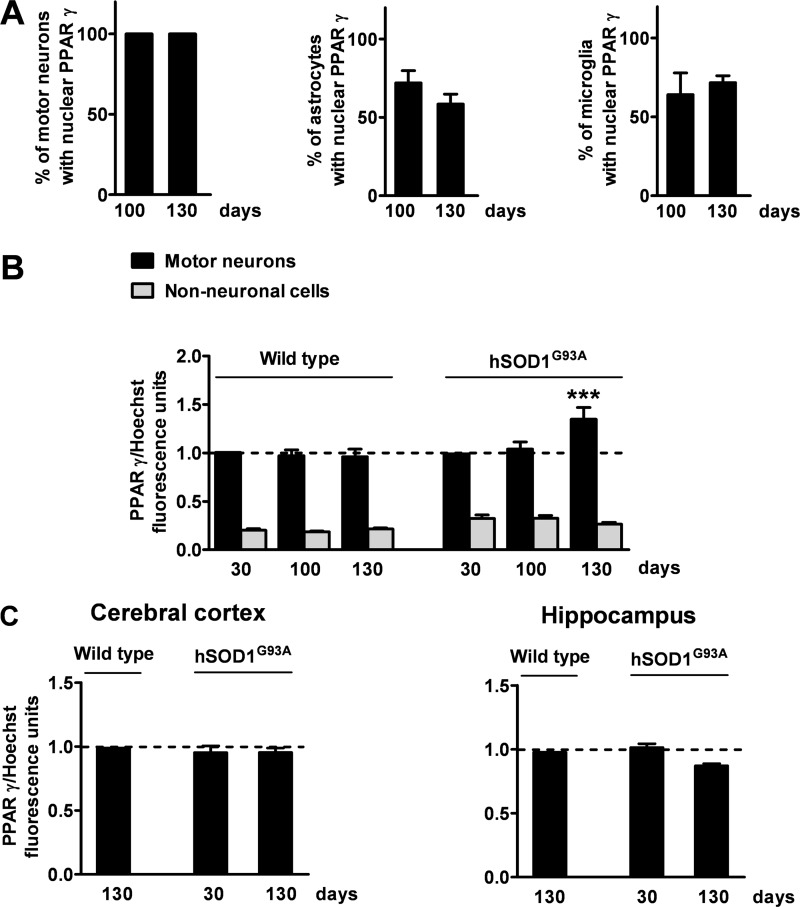
FIGURE 5.
The nuclear concentration of PPARγ is quantitatively enhanced in spinal motor neurons from hSOD1G93A mice at the symptomatic stage of the disease. A, the number of motor neurons, astrocytes, or microglial cells showing PPARγ into the nucleus was determined on spinal cord sections from hSOD1G93A mice taken at 100 (100d) or 130 days of age (130d). Data are expressed as percentage of motor neurons, astrocytes, or microglial cells with nuclear PPARγ out of the total number of cells taken into consideration (n = 40 motor neurons per mouse, n = 45 astrocytes per mouse, n = 100 microglial cells per mouse; n = 5–6 mice per time point). B, the intensity of PPARγ immunofluorescence in the nuclei of motor neurons and non-neuronal cells was determined on lumbar spinal cord sections from wild-type and hSOD1G93A mice stained for PPARγ, the neuronal marker SMI32 and the nuclear dye Hoechst 33342 (n = 15 motor neurons per mouse, n = 30 non-neuronal cells per mouse; n = 3–6 mice per time point). C, the intensity of PPARγ immunofluorescence in the nuclei of cortical and hippocampal neurons was determined on brain sections from hSOD1G93A mice stained for PPARγ, the neuronal marker neuronal nuclei and the nuclear dye Hoechst 33342 (n = 30 cortical neurons per mouse, n = 30 hippocampal neurons per mouse; n = 3 mice per time point). Values were normalized relative to fluorescence intensity of Hoechst 33342, as a measure of DNA content. Data are expressed as mean ± S.E. ***, p < 0.001 versus hSOD1G93A motor neurons at 30 and 100 days of age and wild-type at 130 days of age, two-way ANOVA followed by Bonferroni post hoc test.

