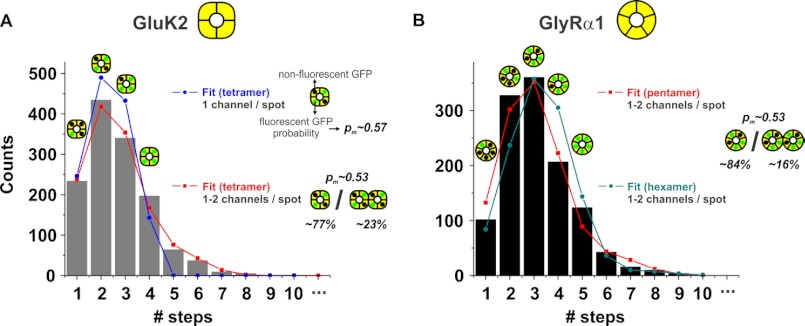
FIGURE 3.
A and B, PIF automated analysis over GluK2 and GlyRα1. A, final step distribution of msfGFP-GluK2 (bars) is fitted to a binomial distribution of 4th order (tetramer) either for purely single-channel spots (blue circles) or allowing the possibility of two channels on the same spot (red squares). The resulting probabilities to detect fluorescence from a fluorescent protein were pm = 57 and 53% for purely single and combined single and double occupancies, respectively. For the latter, the fraction of single occupancy was 77%. B, final step distribution of msfGFP-GlyRα1 was fitted to a 5th order binomial distribution (pentamer) and revealed an identical pm = 0.53 as well as a similar single occupancy (84%) to msfGFP-GluK2. The distribution was also fitted to a 6th order binomial distribution (hexamer) with pm set to 0.53.

