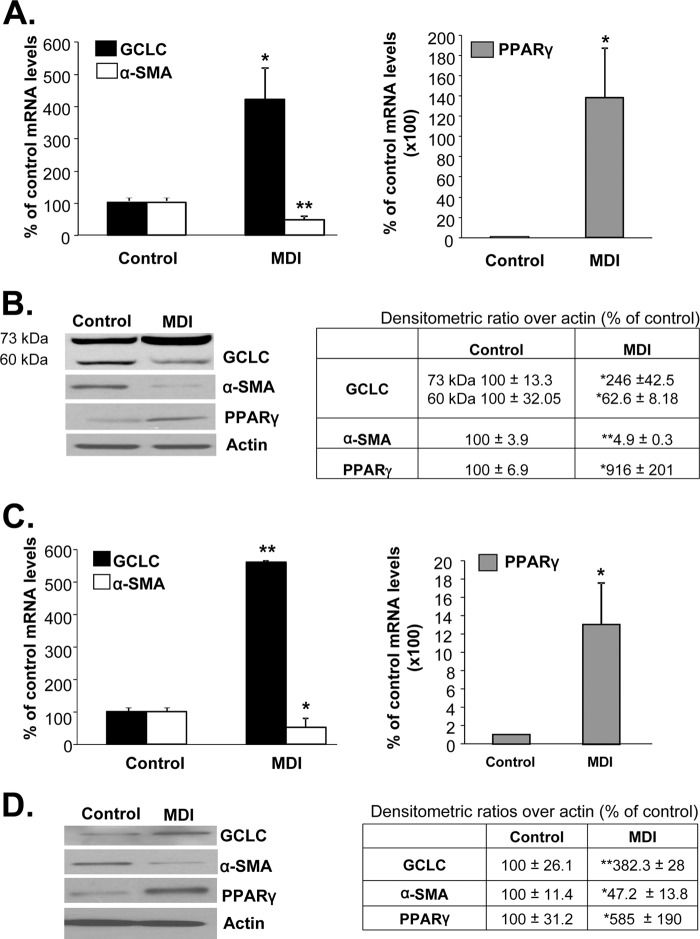
FIGURE 2.
GCLC expression is increased when activated HSCs revert back to quiescence. A and B show changes in mRNA (A) and protein (B) levels of GCLC, α-SMA, and PPARγ following MDI treatment of BSCs, which are activated at base line. The table in B summarizes densitometric changes in the Western blots. Results are from six experiments for mRNA, and three experiments were done in duplicate for protein levels. *, p < 0.05, and **, p < 0.005 versus control. C and D show similar changes in mRNA (C) and protein (D) levels after treatment of in vitro activated primary HSCs with MDI. The table in D summarizes densitometric changes in the Western blots. Results are from two HSC preparations done in duplicate. *, p < 0.05, and **, p < 0.005 versus control.

