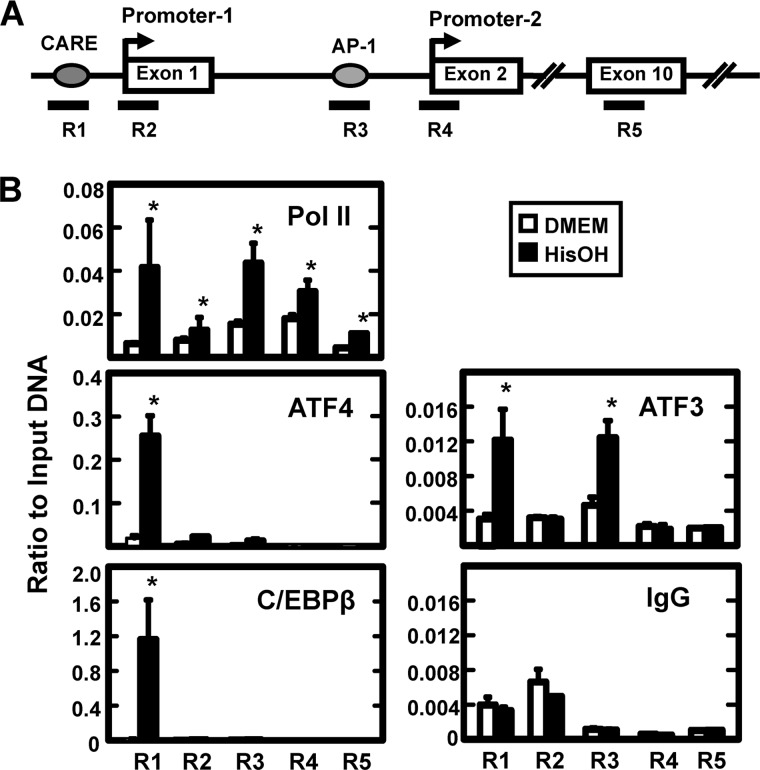
FIGURE 3.
The enrichment of binding for transcription factors at the JMJD3 gene as detected by ChIP. Panel A, drawing depicts the gene structure of JMJD3 and the location of five primer sets used to analyze specific gene regions (R1-R5). Primer sequences are listed in supplemental Table 1. Exon numbers are designated within the boxes. Panel B, HepG2 cells were incubated in DMEM ± HisOH for 6 h prior to ChIP analysis for the enrichment of RNA Pol II, ATF4, ATF3, and C/EBPβ. A nonspecific IgG was used as one negative control and the binding at Exon 10 (primer set R5) was taken as “background” for each antibody. The data are represented as the averages ± S.D. for at least three samples, and the asterisks denote a significant difference of p ≤ 0.05 relative to the DMEM control.

