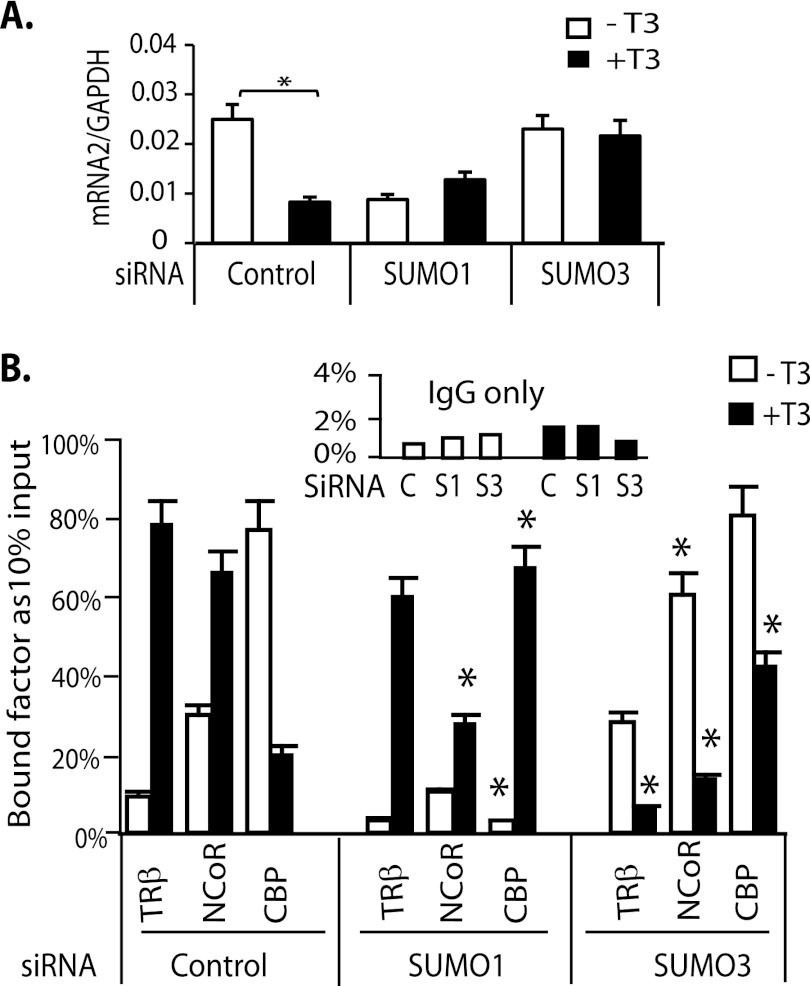
FIGURE 8.
The influence of SUMO1 and SUMO3 on endogenous TSHβ mRNA expression and recruitment of endogenous TRβ and cofactors to the TSHβ nTRE. A, the endogenous T3-responsive TSHβ mRNA was determined using gene-specific primer (GSP2 and GSP3) for cDNA synthesis with cell culture and treatment conditions as described in the legend to Fig. 6. q-PCR primers GSP2 and GSP-reverse were used (see Table 1 for primer sequences). B, ChIP assays using GH3 cells. T3 treatment and assay conditions were the same as described in the legend to Fig. 6. *, indicates significance p < 0.05 compared with control.

