FIGURE 3.
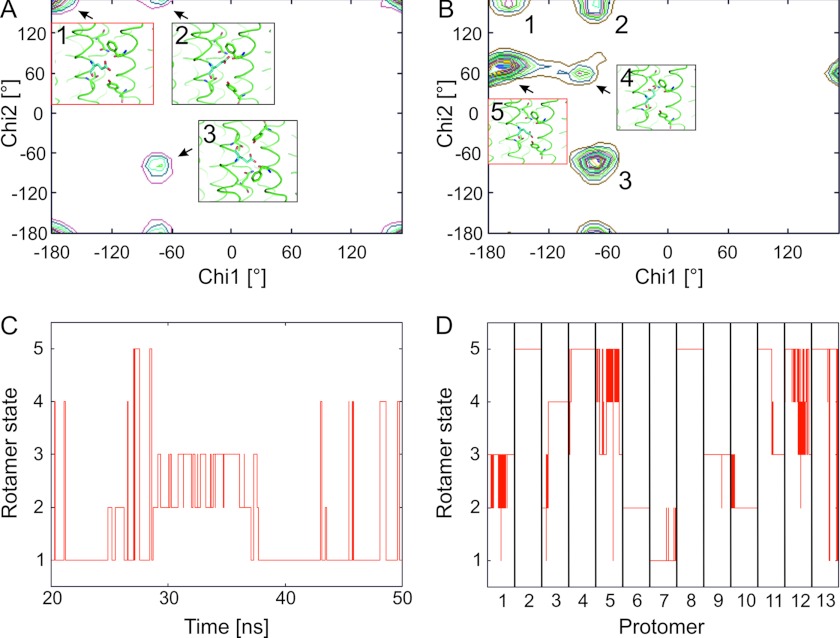
Rotamer states of the side chain of Glu61 from the MD simulation of the 13protonated system. A and C, states of deprotonated (charged) Glu61 rotamers. B and D, states of protonated (uncharged) Glu61 rotamers. A, distribution of rotamer states according to the χ1/χ2 map. The number of rotamer states is qualitatively indicated by 20 equally spaced contour lines. The insets show the most abundant rotamer states 1–3 with 1 being the most populated one (red frame). B, distribution of rotamer states according to the χ1/χ2 map. The insets show the two rotamer states not observed for the deprotonated Glu61 (see panel A). Rotamer 5 is the most populated one (red frame). C, transitions between rotamer states along the trajectory. States 1–3 correspond to the ones shown in panel A; rotamer states 4 and 5 are lowly populated and, hence, not shown in panel A. D, transitions between rotamer states along the trajectory for each of the 13 protomers. States 1–5 correspond to the ones shown in panel B. Each column represents a trajectory from 20–50 ns.

