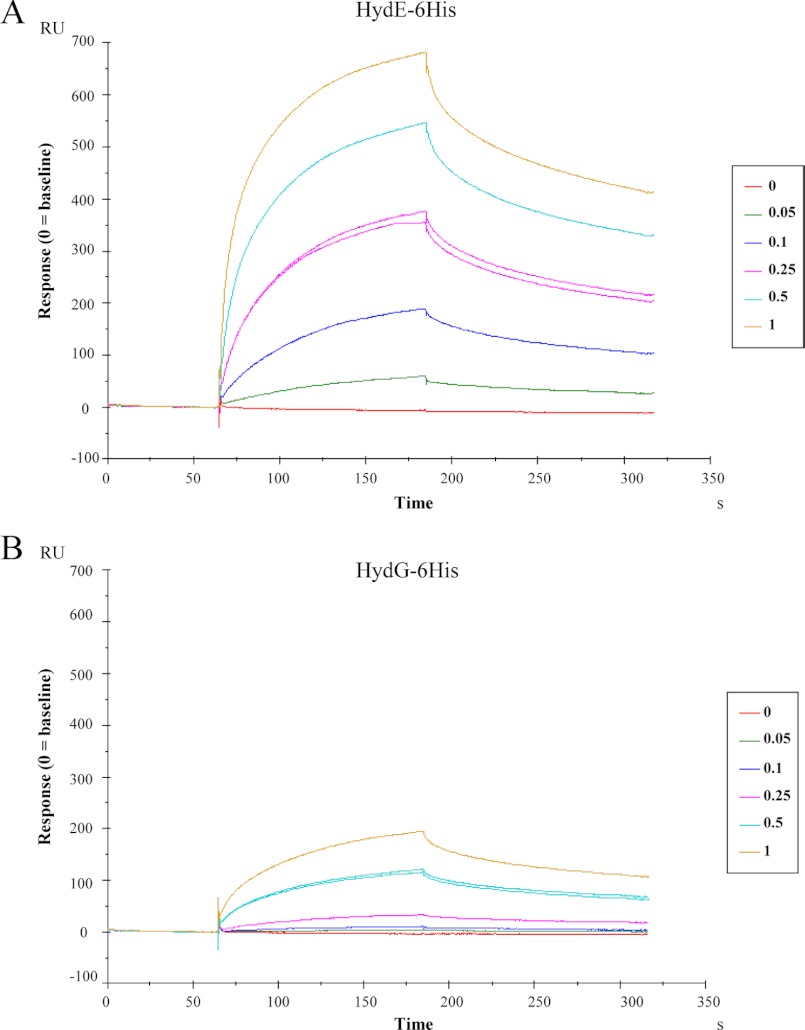
FIGURE 3.
Kinetics of the HydE-6His·HydF-StrepII and HydG-6His·HydF-StrepII interactions by means of SPR signal detection. HydE-6His (panel A) or HydG-6His (panel B) solutions (analytes) at the concentrations (μm) indicated in the boxes were injected over a sensor chip where HydF-StrepII (ligand) was previously covalently immobilized in a Biacore T100 instrument (see the “Experimental Procedures” for details). SPR signal is shown as sensorgram, and the time course of the surface plasmon resonance response reported in resonance units (RU). Each sensorgram has been subtracted of the corresponding signal produced on a control surface and normalized to baseline. One solution of each analyte was injected twice at the same concentration (0.25 μm HydE-6His and 1 μm HydG-6His), as further control. 0 concentrations corresponded to dilution buffer.

