Fig. 2.

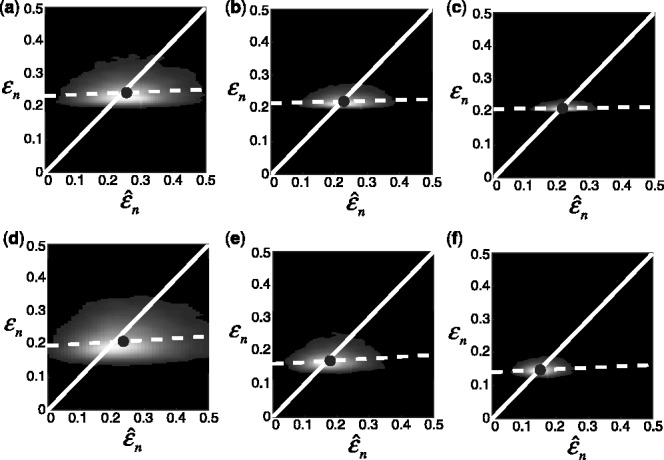
Joint distribution of the true and estimated errors for n = 30, 60, 120, d = 5, two classification rules (LDA and RBF-SVM) and two error estimation methods (5F-CV and LOO). The covariance matrices are equal with features uncorrelated for LDA and unequal with features correlated for RBF-SVM: (a) n = 30, LDA, 5F-CV,  (b) n = 60, LDA, 5F-CV,
  (c) n = 120, LDA, 5F-CV,
  (d) n = 30, RBF-SVM, LOO,
  (e) n = 60, RBF-SVM, LOO,
  (f) n = 120, RBF-SVM, LOO,
  The white line shows the
  axis, the dotted line shows the regression line and the circle indicates the sample mean of the joint distribution
