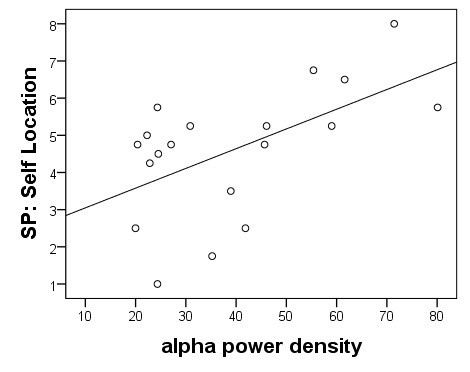
Figure 10.

Correlation between SP ratings and brain activation. Depicted is the correlation between the SP rating in self-location (one dot is the value of one participant) and the mean brain activation (alpha band power in mV) in the DLPFC of both hemispheres (left hemisphere: -30; 15; 15, right hemisphere: 30; 15; 15).
