
Figure 8.
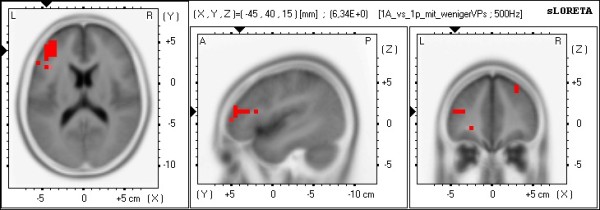
sLORETA images of the comparison 1PP-active vs. 1PP-passive. Shown are the functional sLORETA images for the comparison 1PP-active vs. 1PP-passive in the theta frequency band. Increased activity in 1PP-active compared with the 1PP-passive condition is labeled red, decreased activity is labeled blue.