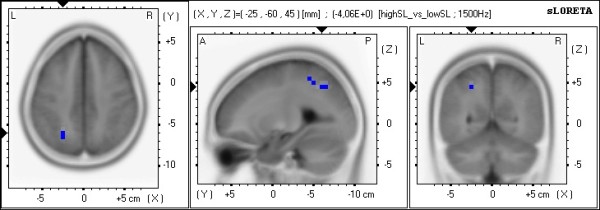
Figure 9.

sLORETA images of High SP vs. Low SP. Shown are the functional sLORETA images for the comparison High SP vs. Low SP in the alpha2 frequency band. Increased activity in High SP compared with the Low SP condition is labeled red, decreased activity is labeled blue.
