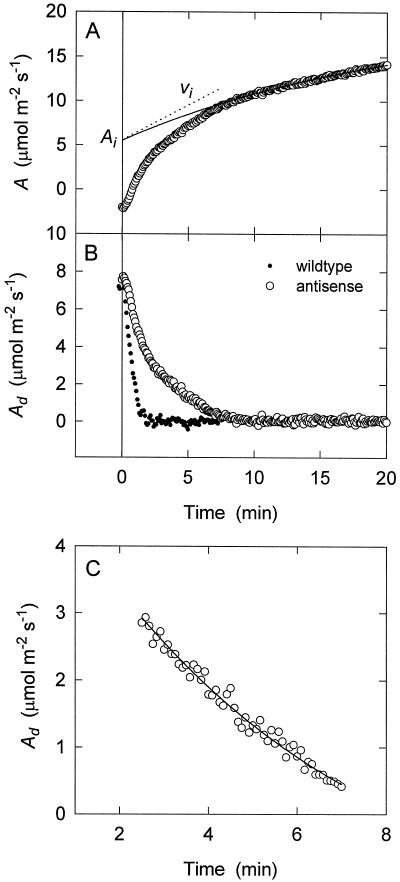
Figure 2.
Resolution of the various phases from the activation of A following illumination of a darkened antisense leaf. A, A trace (○) with an exponential curve fit to the exponential portion (solid line). The amount of Rubisco sites sequestered in the E*R form (Ai) and the vi were calculated from extrapolation of this exponential curve to time 0. B, Difference between the exponential fit and the measured A (Ad) plotted over time for an antisense plant (○) and a wild-type plant (•). C, Portion of the antisense data after the rapid RuBP-limiting phase and before the later exponential Rubisco phase (when Ad equals 0; see Results) plotted over time. To these data another exponential curve of the same form as that used to characterize the Rubisco phase was fitted (line).

