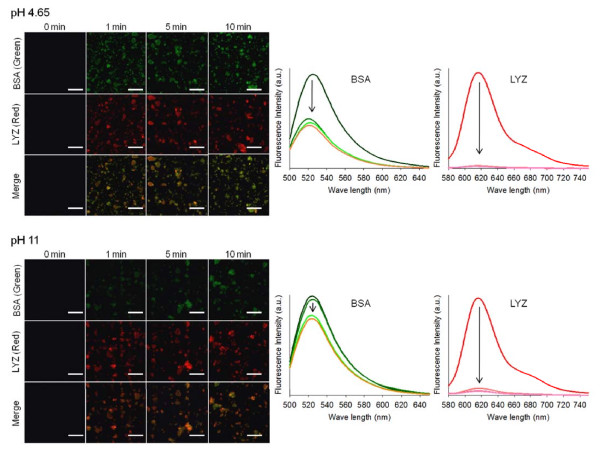
Figure 6.
Confocal images of BSA and LYZ adsorbed onto Si-MNPs@SH for 10 min. Confocal images of BSA (green) and LYZ (red) adsorbed onto Si-MNPs@SH (the scale bar is 4 μm) for 10 min at pH 4.65 and pH 7.5 (left). Fluorescence intensities corresponding to the changes of emission intensity of protein solution (right).

