
Figure 1.
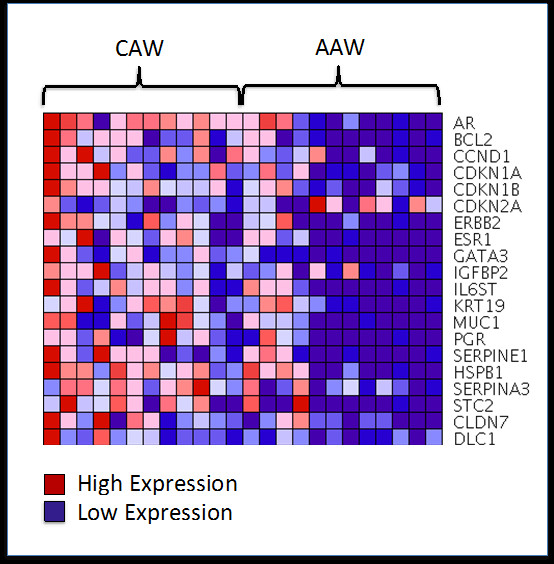
Heat map illustrating differences in the expression of 20 breast cancer-associated genes between AAW and CAW breast cancer patients.
Official websites use .gov
A
.gov website belongs to an official
government organization in the United States.
Secure .gov websites use HTTPS
A lock (
) or https:// means you've safely
connected to the .gov website. Share sensitive
information only on official, secure websites.
Heat map illustrating differences in the expression of 20 breast cancer-associated genes between AAW and CAW breast cancer patients.