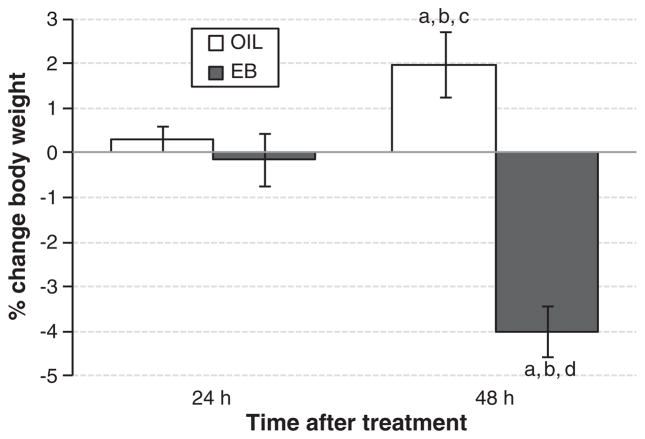
Fig. 2.
Change in body weight (% change from Day 1) in OIL- (open bars) and EB- (filled bars) treated OVX rats 24 h after the first EB or OIL treatment (left bars) or 48 h after the second EB or OIL treatment (right bars). a = significantly different from values 24 h after the first OIL treatment. b = significantly different from values 24 h after the first EB treatment. c = significantly different from values 48 h after the second EB treatment. d = significantly different from values 48 h after the second OIL treatment.

