
Figure 1. Alterations in intracellular Ca2+ concentration immediately following 3 h of low Mg2+-induced in vitro SE.
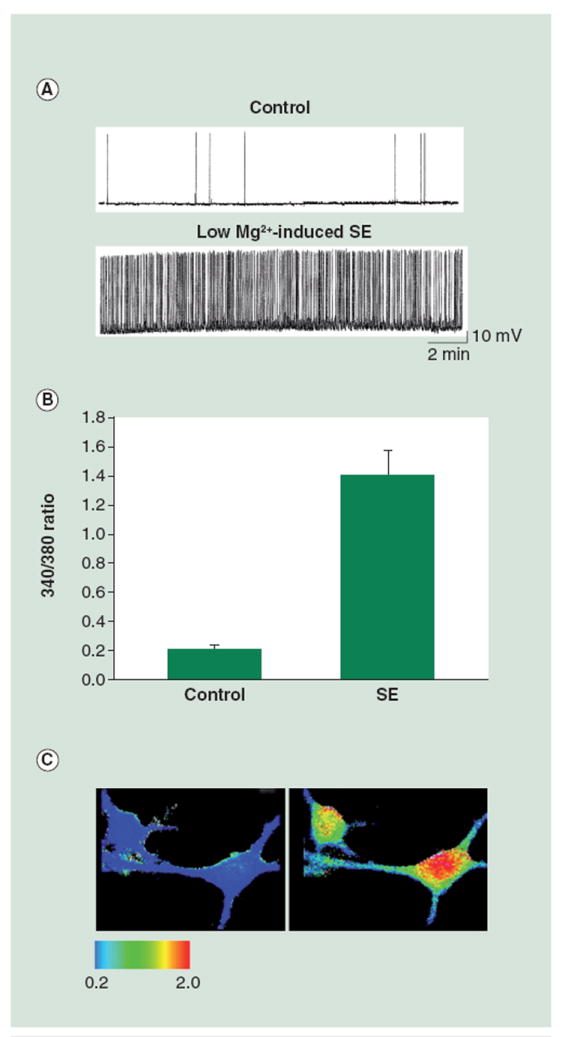
(A) Representative whole-cell current-clamp electrophysiological recording obtained from a control neuron and a neuron in low Mg2+ or in vitro SE. The neuron in low Mg2+ shows epileptiform discharges at a frequency greater than 3 Hz. By contrast, the control neuron shows action potentials intermittently, consistent with baseline firing activity. (B) Bar graph comparing fura-2 340/380 ratios in control neurons versus neurons immediately following 3 h of low Mg2+. The low Mg2+-treated cells exhibit ratio values of 1.4 ± 0.17 as compared with the control neurons with values of 0.20 ± 0.04 (data expressed as mean ± standard error of the mean). (C) Representative pseudocolor ratio images obtained from control (left panel) and low Mg2+-treated (right panel) neurons. Neurons from the low Mg2+ group show an increased 340/380 ratio immediately following treatment. SEM: Status epilepticus.
(A) reproduced with permission from [83].