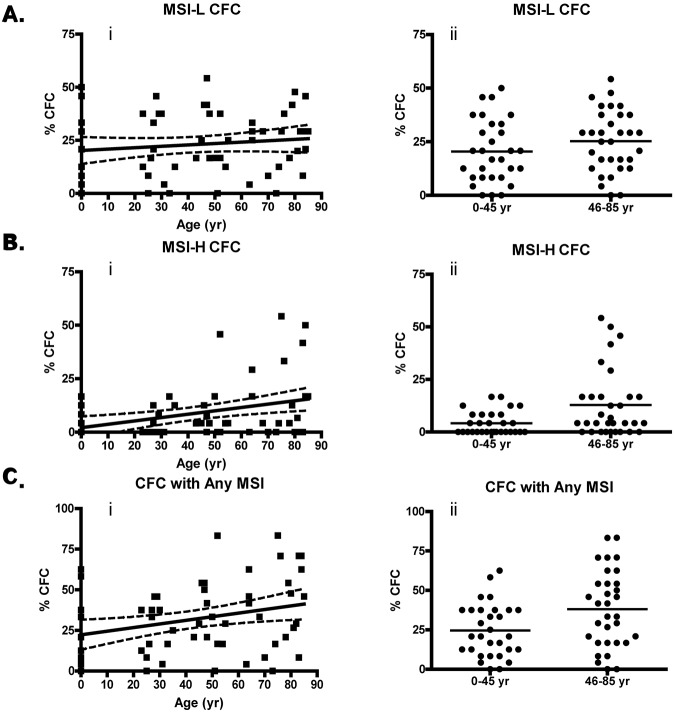
Figure 1.
MSI-positive CFUs accumulate with age. (A) Percentage of CFCs with low-grade instability with age (i; P = .30) and percentage of MSI-L CFCs from donors ≤ 45 years compared with those > 45 years by unpaired t test (ii; P = .17). (B) Percentage of MSI-H CFCs with donor age (i; P = .0032) and percentage of MSI-H CFCs from donors ≤ 45 years compared with those > 45 years by unpaired t test (ii; P = .0084). (C) Percentage of CFCs with any (MSI-H or MSI-L) detectable MSI with age (i; P = .017) and percentage of CFCs with any MSI from donors ≤ 45 years compared with those > 45 years by unpaired t test (ii; P = .015). Linear regression was performed with Welsh correction for variance. The solid line in the linear regression analysis represents a curve of best fit, and the dashed line indicates a 95% confidence interval.

