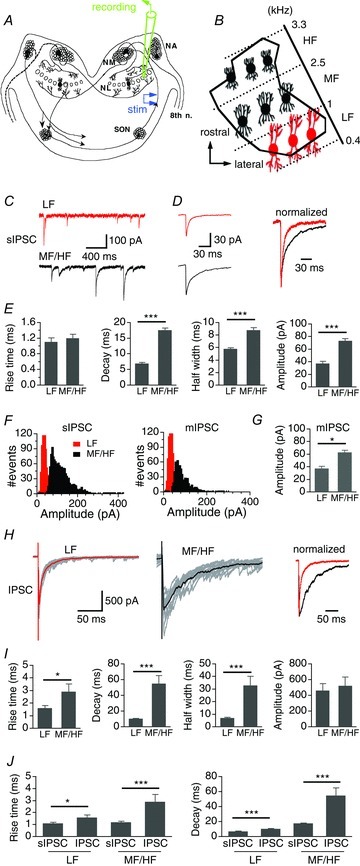
Figure 1. MF/HF NL neurons have slower IPSC kinetics compared to LF neurons.

A and B, schematic diagram of the avian auditory brainstem. NA, nucleus angularis; NM, nucleus magnocellularis; SON, superior olivary nucleus; 8th n, cranial nerve VIII. The NL was divided into three regions according to the neurons’ characteristic frequency (CF) (adapted from Rubel & Parks, 1975). LF, MF, and HF: low, middle and high CF, respectively. C, representative sIPSCs from a LF neuron (top panel, red) and a MF/HF neuron (lower panel, black). D, left, average sIPSCs. Right, average sIPSCs normalized to the peak. E, summary of rise time, weighted decay time constant, half-width, and amplitude of sIPSCs in LF (n = 27) and MF/HF neurons (n = 49). No significant difference was detected in rise time, whereas the decay, half-width, and the amplitude of sIPSCs of MF/HF neurons were significantly larger than those of LF neurons. F, representative sIPSC amplitude histograms (bin width of 5 pA) of both a LF and a MF/HF neuron showed unimodal and normal distributions. Miniature IPSCs (mIPSCs) recorded in the presence of TTX showed similar amplitude distributions. G, the amplitude of mIPSCs of LF neurons (n = 5) was significantly smaller than that of MF/HF neurons (n = 5). H, left and middle, superimposed individual IPSCs (grey) in response to single-pulse stimulations, with the average IPSCs highlighted (thick red and black traces). The IPSC amplitude was close to that of the maximal responses. Right, average IPSCs normalized to the peak. I, summary of rise time, weighted decay time constant, half-width, and amplitude of IPSCs in LF (n = 21) and MF/HF neurons (n = 21). IPSCs of MF/HF neurons had slower rise time, decay, and hence broader width compared to those of LF neurons. J, the kinetics of IPSCs elicited by single-pulse stimulations was slower than that of sIPSCs, regardless of the CF region. In this and subsequent figures, bars represent means ± SEM; *P < 0.05, **P < 0.01, and ***P < 0.001 (t test, unless indicated otherwise). Cells were held at −60 mV for voltage-clamp experiments.
