
Figure 9. Properties of Ih and distribution of HCN4 in PVeGFP positive neurons.
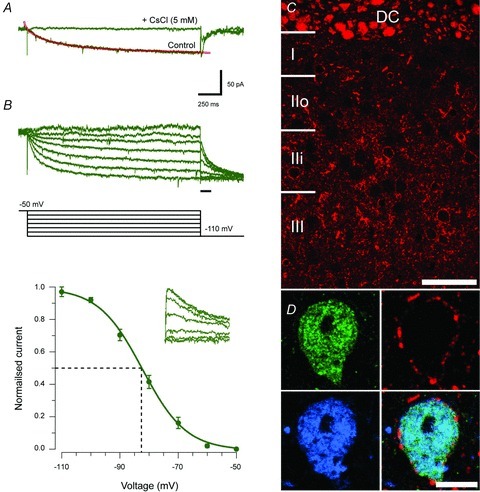
A, Ih was activated by a hyperpolarizing voltage step (−50 mV to −110 mV for 2 s). This current was completely abolished by the addition of 5 mm CsCl to the bath (n = 6). The amplitude of the steady state current during this step (i.e. over the last 50 ms) was defined as Ih amplitude and two time constants (fitted over 20–80% of current amplitude) were fitted (red line) to the current's rising phase to quantify its activation kinetics. B, family of Ih currents (green traces, top) in response to a two-step voltage protocol (black traces, middle) showing the voltage dependence of Ih activation. The protocol consisted of a series of 2 s presteps (−110 to −50 mV, in 10 mV increments) followed by a test step to −110 mV (500 ms duration). Current–voltage plot shows normalized group data for Ih activation calculated using the tail currents: shown in inset on an expanded time base (denoted by black bar in protocol above). C, distribution of immunolabelling for HCN4 in sagittal sections of the lumbar dorsal horn. Strong immunolabelling is found in presumed axons in the dorsal columns (DC) as well as the cell membranes of a subset of dorsal horn neurons. D, we found that the majority (>90%) of dorsal horn neurons showing immunoreactivity for both PVeGFP (green) and PV (blue) were also immunolabelled for HCN4 channels (red). Overlayed images (bottom right) shows merged image. Scale bars: C = 50μm; D = 10 μm.