
Figure 1. M1 muscarinic agonist increased the frequency of mEPSCs recorded from CA1 pyramidal neurons.
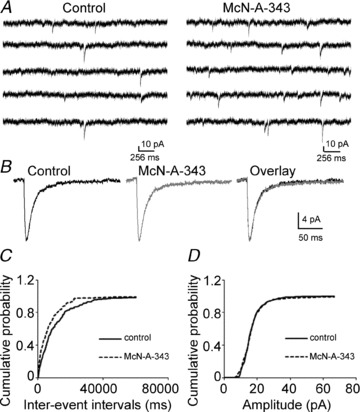
A, representative traces of mEPSCs recorded from CA1 pyramidal neurons before (left) and after (right) the application of 10 μm McN-A-343. B, representative averaged traces of mEPSCs before (black) and during (grey) the application of McN-A-343 along with the overlay of the two traces. C and D, cumulative probability plots of mEPSC frequency (C) and amplitude (D) obtained by pooling data from 7 neurons before (continuous lines) and after (dashed lines) application of McN-A-343.