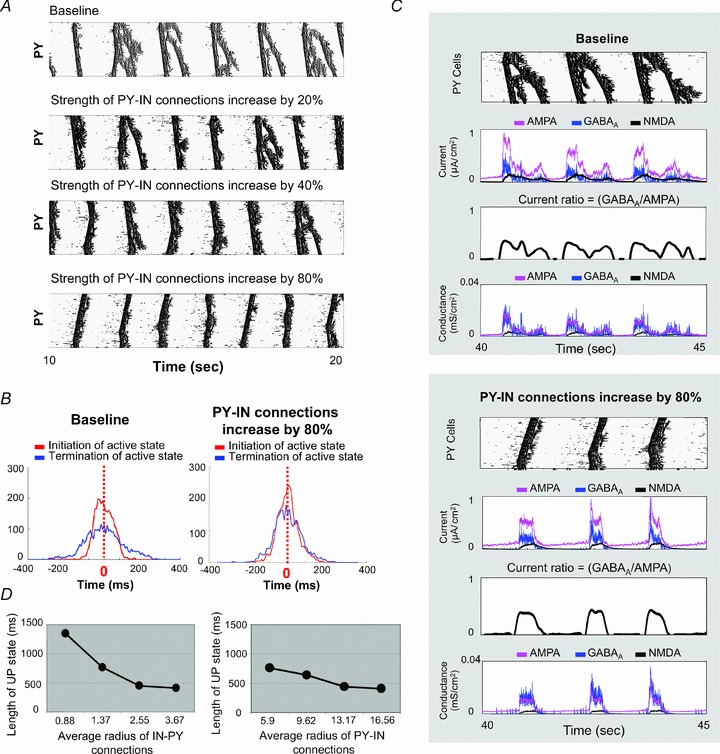
Figure 6. Impact of the strength and radius of PY neuron–IN connections on synchrony of downward transitions during sleep slow oscillation.

A, four rastergrams acquired from simulations with different strength of PY neuron–IN connection (baseline, and increasing to 20%, 40% and 80% above the baseline). B, distributions of initiation and termination times of active state are displayed. Increasing the strength of PY neuron–IN improved the degree of synchrony of the downward transition (blue line) that approached the level of synchronization of the upward transition (red line). C, the rastergrams of PY activity, the traces of synaptic currents, the ratio of GABAA/AMPA, and the traces of synaptic conductances are plotted here. When the strength of PY neuron–IN connections was increased, the ratio GABAA/AMPA remained high till the end of active state. D, dependence of the duration of active state on the average width of IN–PY neuron or PY neuron–IN connections is shown.
