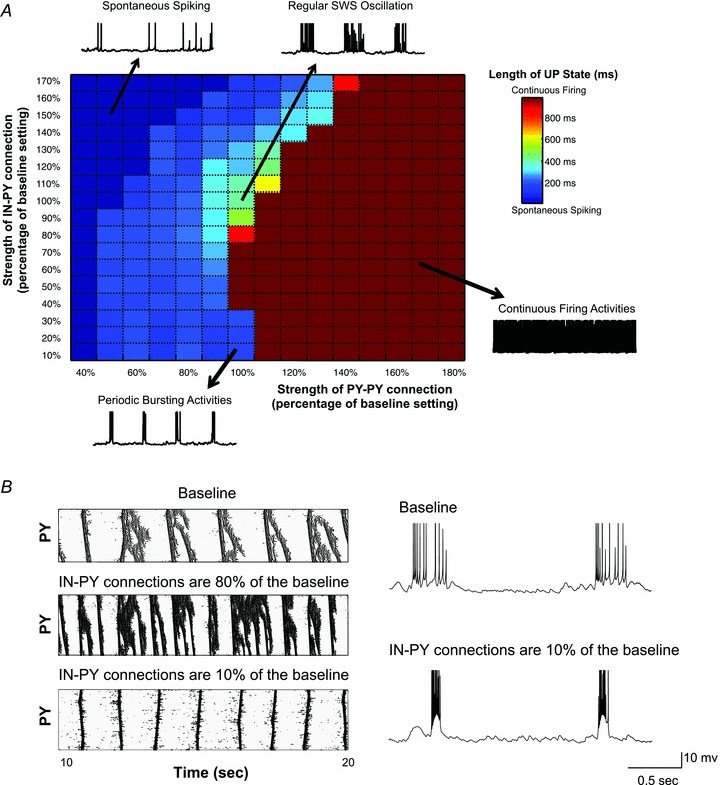
Figure 7. Influence of excitatory and inhibitory synaptic strength on the duration of active states during slow oscillation.

A, the average length of active states is plotted based on different combinations of the strength of the intracortical excitatory (PY→PY) and inhibitory (IN→PY) connections. Sample traces of the PY neuron membrane potential illustrate typical examples of PY activity (e.g. spontaneous spiking, periodic bursting, regular slow oscillation, continuous firing). Colour bar indicates the average length of active states. B, the rastergrams and representative traces of the PY neuron membrane voltage were obtained from simulations with different strengths of the IN–PY neuron connection. Short and bursting activity appeared when the strength of the IN–PY neuron connection was significantly reduced (10% of the baseline in this case).
