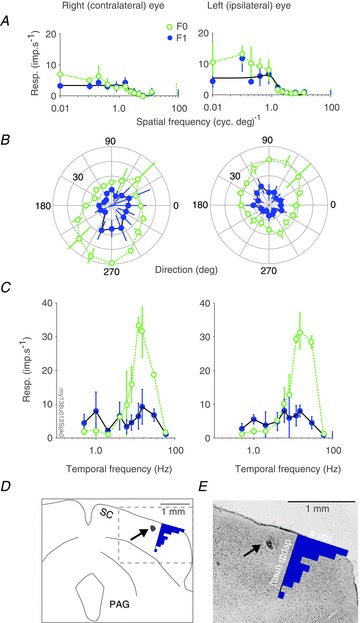
Figure 1. Example recordings from a neurone recorded in, and electrolytic lesion created by recording electrode in, marmoset superior colliculus.

A–C, spatial frequency (A), direction (B), and temporal frequency (C) tuning curves measured in response to stimulations through either the contralateral (left column) or the ipsilateral (right column) eye of a visually responsive neurone in marmoset superior colliculus. Open green symbols show F0 response; filled blue symbols show F1 response; vertical lines at the rightmost x-axis limits show spontaneous activity; error bars report standard deviation. Smooth black lines in A show the difference of Gaussians model that best fits the F1 responses. Stimulus parameters for panel A: grating drift direction 145 deg, drift rate 5Hz, aperture diameter 4 deg. D–E, drawing (D) of coronal section (E) through the midbrain of the marmoset at the level of the superior colliculus, processed with Nissl stain (cresyl violet). Dashed box in D shows the region displayed in E. Black arrow points to electrolytic lesion. The overlay histograms show the encounter position of recorded neurones relative to the (dorsoventral) position where visually driven multiunit activity was observed. PAG: periaqueductal grey; SC: superior colliculus.
