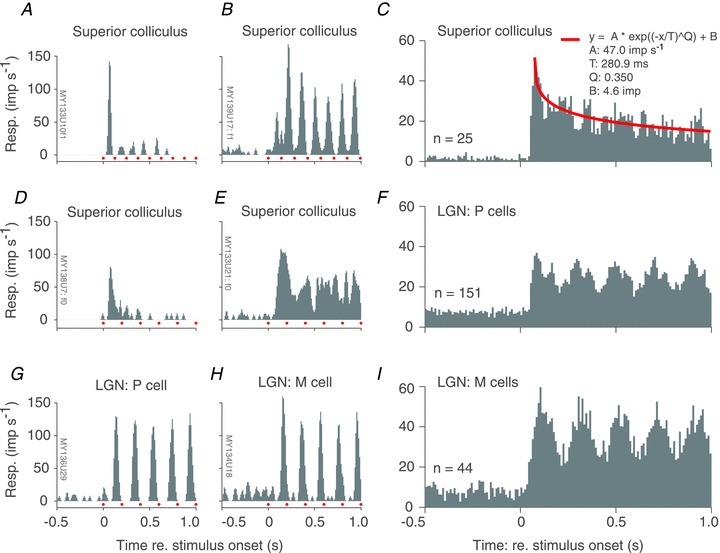
Figure 2. Nature of visual response in marmoset superior colliculus: example cells.

A, B, D and E, peri-stimulus time histograms (PSTHs) obtained from four different marmoset superior colliculus (SC) neurones during the 500 ms preceding and 1000 ms following the onset of a drifting achromatic grating (red dots immediately above x-axis indicate the temporal period of the grating). During the interval preceding grating onset (at time = 0) the animal viewed a uniform grey screen of the same mean luminance as the grating. Responses are dominated either by the F1 (A and B) or F0 (D and F) component, and are either relatively transient (A and D) or sustained (B and E). C, population average PSTH for a sample of SC neurones. Stimulus temporal frequency and spatial phase varied across cells, so no period markers are provided. Red continuous line shows best fit of stretched exponential decay function. F and I, PSTHs obtained from example parvocellular (F) and magnocellular (I) neurones recorded in marmoset lateral geniculate nucleus (LGN).
