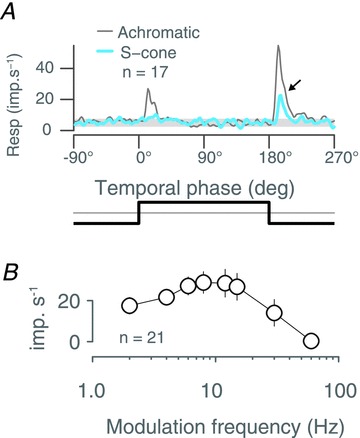
Figure 3. Population average response to slow, square wave modulation of a large uniform field.

A, superior colliculus population average response to two cycles of 0.5 Hz square wave temporal modulation of an achromatic (thin grey trace) or S cone selective (thick blue trace) uniform field. Note response to offset of S cone modulation (arrow). The temporal profile of the stimulus is illustrated below the graph. B, population average temporal frequency tuning for drifting achromatic gratings. Error bars show standard errors of the mean.
