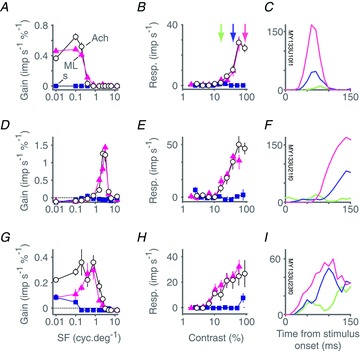
Figure 4. Selectivity of cone inputs to superior colliculus revealed via spatial and contrast tuning: example cells.

A–C, spatial frequency tuning (A) and contrast response (B) of a superior colliculus neurone for drifting achromatic (open circles), ML cone selective (magenta triangles) and SWS cone selective (blue squares) gratings. C, PSTH recorded over the first 150 ms following onset of a drifting achromatic grating or varying contrast (constructed from data shown in B). The discharge of the cell is modulated at the frequency of stimulation (F1). Colour code in C indicates grating contrast as identified by x-axis location of the corresponding collared vertical line in B. Error bars (sometimes concealed by data points) show standard errors of the mean. D–F, same as A–C but for a cell in which stimulation primarily induced an elevation in the mean rate of discharge (F0). G–I, same as A–C but for another cell in which stimulation primarily induced an elevation in the mean rate of discharge (F0). This cell shows the strongest indication of SWS cone input (at low spatial frequencies) of all the cells in our sample. Baseline responses (maintained discharge) have been subtracted from amplitude graphs.
