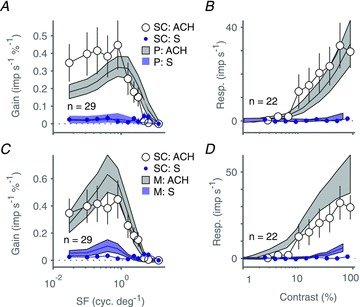
Figure 7. Comparison of the relative strength of S cone inputs to superior colliculus (SC) neurones and to neurones in lateral geniculate nucleus (LGN).

A and B, population average spatial frequency (A) and contrast (B) tuning of SC neurones for drifting achromatic gratings (large open circles) and SWS cone selective gratings (small blue symbols); data are reproduced from Fig. 5A. Filled grey (upper) and dashed blue (lower) polygons show bootstrapped mean and 95% confidence intervals for the equivalent population tuning of parvocellular (P) LGN neurones. C and D, same as A and B but comparison is now with magnocellular (M) LGN neurones. Error bars show standard errors of the mean; n listed in each panel identifies the number of superior colliculus neurones contributing to the population average, and the number of P and M neurones drawn from our LGN database on each bootstrap resample. Baseline responses (maintained discharge) have been subtracted from amplitude graphs.
