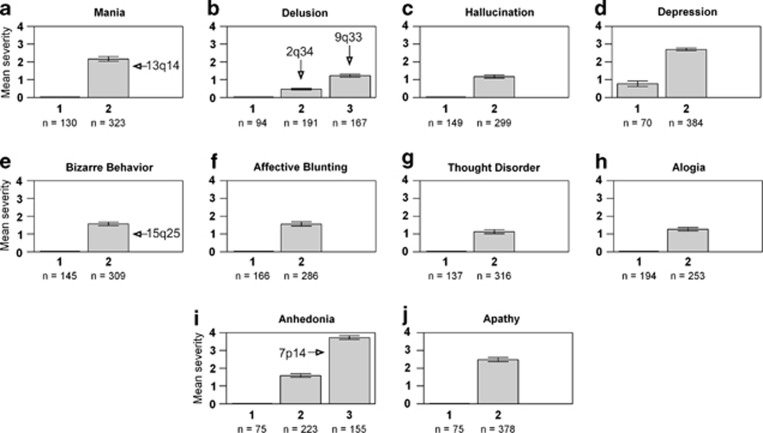
Figure 1.
Each figure panel (a–j) represents the summary of the mean level severity of a given dimension within subtypes. For each subtype and each dimension, the figures show the mean severity level and its 95% confidence interval, and the number of subjects classified in each subtype (according to their most likely subtype). On each barplot, the arrow identifies the subtype yielding an enhanced or a new linkage result on the genome region identified above the arrow.

