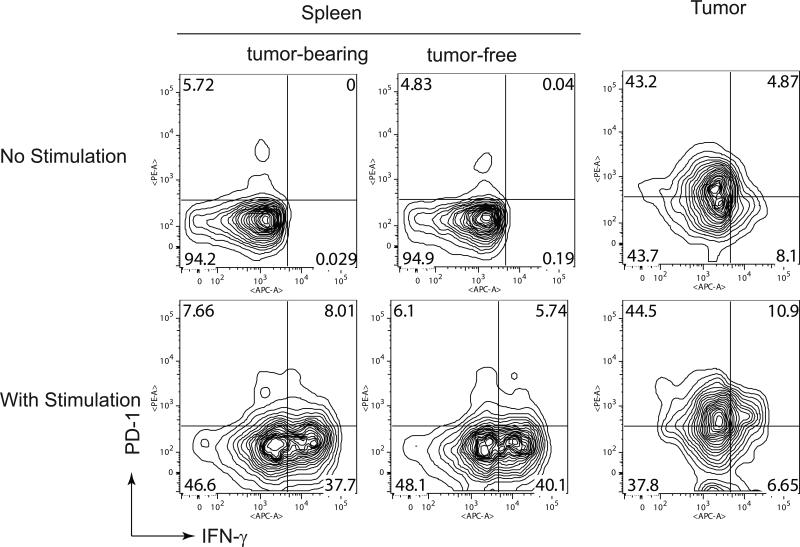
Figure 1.
The expression of PD-1 by transferred T cells at the tumor and spleen of mice receiving ACT treatment. Mice with or without 7-day established B16 tumor were transferred with cultured T cells from pmel-1 TCR/Thy1.1 transgenic mice. Six days after T-cell transfer, single cell suspensions were obtained from spleens and tumors and stimulated with gp100-peptide pulsed DC in the presence of Golgi stop for 4 hours. Lymphocytes with or without stimulation were evaluated by flow cytometry for PD-1 versus IFN-γ after gating on CD8+ and Thy1.1+. Number indicates the percentage of cells showing in each quadrant. The flow data was obtained from pooled lymphocyte samples from 5 mice in each group. Two independent studies showed similar results.

