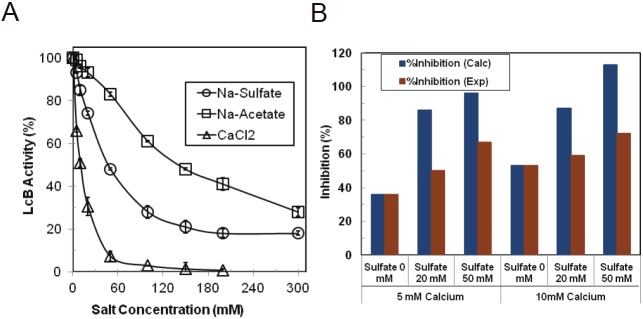
Figure 4.
Catalytic activities of LcB in the presence of sodium sulfate, sodium acetate, and calcium chloride when added separately to the reaction mixtures (A), and when acetate and sulfate were added in combination to the reaction mixtures (B). In B, the blue bars represent the expected %inhibition if the individual inhibition by sulfate and calcium were additive, and the red bars represent the experimentally determined %inhibition for the indicated pairs of sulfate and calcium. Percent LcB acitivity indicates the relative activity in absence of any additions. The data represent an average of five independent assays. Standard deviation is shown by bars.

