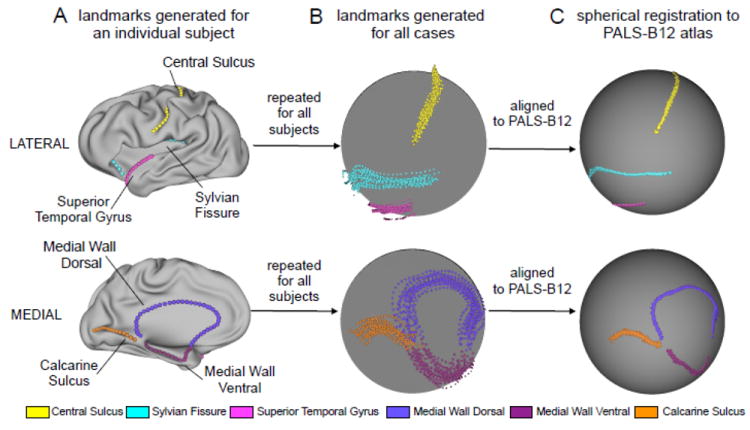
Figure 1.

General framework of PALS-B12 registration procedure. Core 6 landmarks are displayed on the lateral (top panel) and medial (bottom panel) surface representations. (A) An individual subject example is shown with all landmarks marked on a moderately inflated surface representation for ease of visual inspection. Here results from the expert neuroanatomical rater (ENR) are shown for a single case. (B) As noted in the main text, landmarks for every subject were generated by: automated landmark identification (ALI), ALI landmark correction (ALI-Corrected), two trained raters (R1 & R2), and ENR. This yielded a total of five landmark sets across each subject (i.e. ALI, ALI-corrected, R1, R2 and ENR). This process was then repeated for all subjects. Results across subjects are shown for all five landmarks on a spherical representation (ENR results are used an exemplar). (C) All individual subject surfaces were then registered using a spherical registration algorithm to the PALS-B12 atlas (Van Essen, 2005). Results following PALS-B12 registration are shown on a standard spherical 73,730-vertex representation (again ENR results are used as an exemplar). This figure is extended to illustrate the SBR procedure across all raters (Fig. 2).
