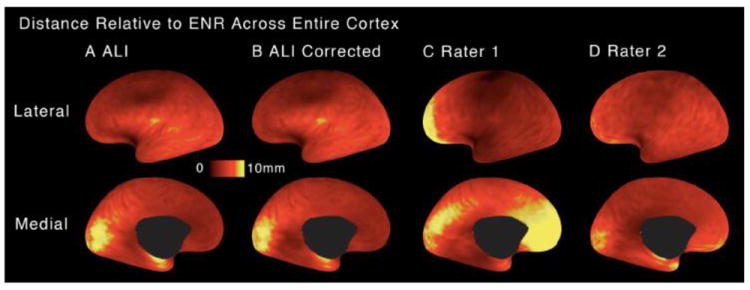
Figure 6.

Mean 3D cortical distances following SBR to the PALS-B12 atlas is shown on a flattened surface configuration relative to the expert neuroanatomical rater (ENR) for: (A) automated landmark identification (ALI), (B) ALI-Corrected, (C) Rater 1, (D) Rater 2. Brighter colors mark areas of greater mean 3D distance from the ENR. Critically, results illustrate deviations for each rater from ENR once SBR was carried out separately for landmarks generated by each rater (illustrated in Fig. 2).
