
Figure 4.
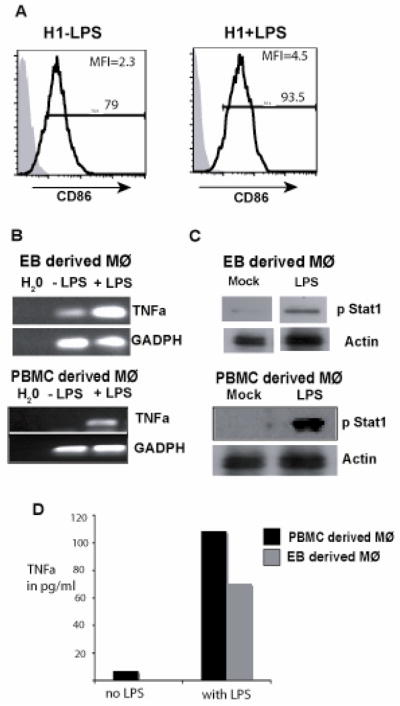
H1 derived macrophages show TLR specific responses similar to PBMC derived macrophages. (A) In order to determine TLR function, H1 EB - derived Mφ’s were stimulated with LPS for 18 hours. Following stimulation the cells were analyzed by flow cytometry for CD86 upregulation. Shaded histograms represent isotype controls. (B) Following LPS stimulation, the cells were assayed for TNFα expression by RT-PCR analysis. (C) Phosphorylation of STAT-1 was quantitated following stimulation in presence of LPS in both EB and PBMC - derived Mφ’s. Data are representative of 2 independent experiments. (D) EB and PBMC derived cells were subjected to TNFα ELISA following LPS stimulation for 6 hrs. The experiment was performed in duplicates.