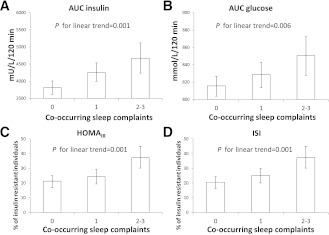
Figure 1.
Geometric means of AUC of insulin (A) and glucose (B) and adjusted percentage of insulin-resistant individuals (percentage of individuals in the top quartile of HOMA-IR [C] and in the bottom quartile of ISI [D], adjusted for sex, age, alcohol consumption, current smoking status, regular exercise, occupational status, BMI, and family history of diabetes) and 95% CIs (error bars) according to accumulation of co-occurring sleep complaints.

