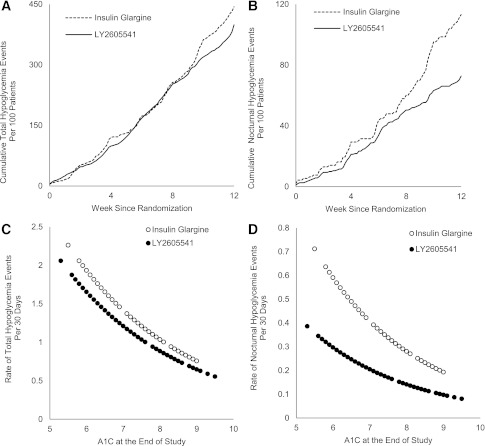
Figure 1.
A and B: Number of total and nocturnal hypoglycemia events per 100 patients over the 12-week treatment period. C and D: The rate of total and nocturnal hypoglycemia events based on A1C values over 12 weeks. The relationship between the hypoglycemia event rate during the treatment period and the end point A1C was characterized by the negative binomial regression curve of hypoglycemia event rate on the end point A1C. In A and B, the dashed line = insulin glargine and the solid line = LY2605541. In C and D, open circle = insulin glargine and closed circle = LY2605541.

