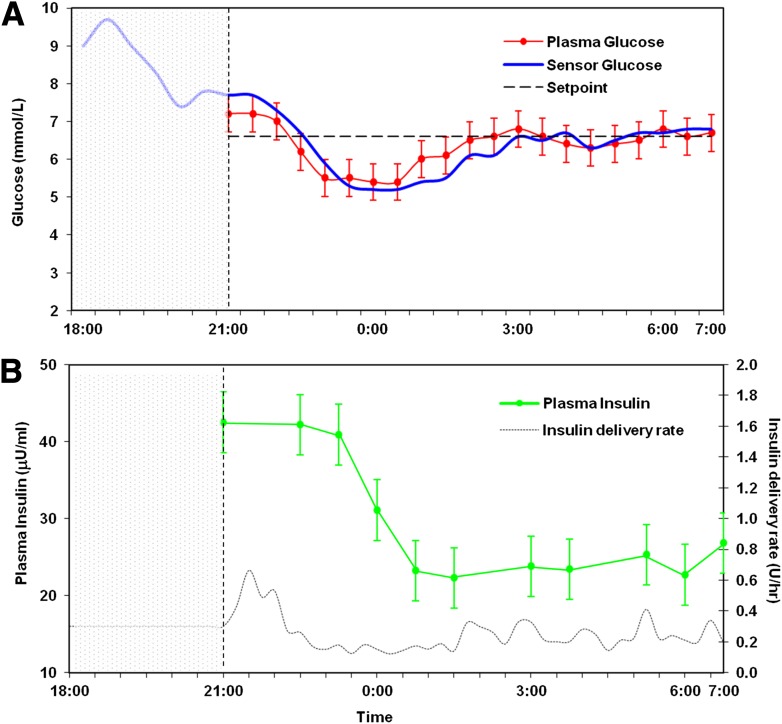
Figure 2.
Summary of the overnight closed-loop experiment in the eight participants. The open-loop period is represented by the shaded area. An evening meal and prandial bolus were administered at 1800, and the closed-loop mode commenced at 2100. A: Sensor glucose (blue) closely tracks plasma glucose (red). B: Pump delivery rates are represented as a black dashed line, and hourly plasma insulin measurements are represented in green.

