
Figure 2.
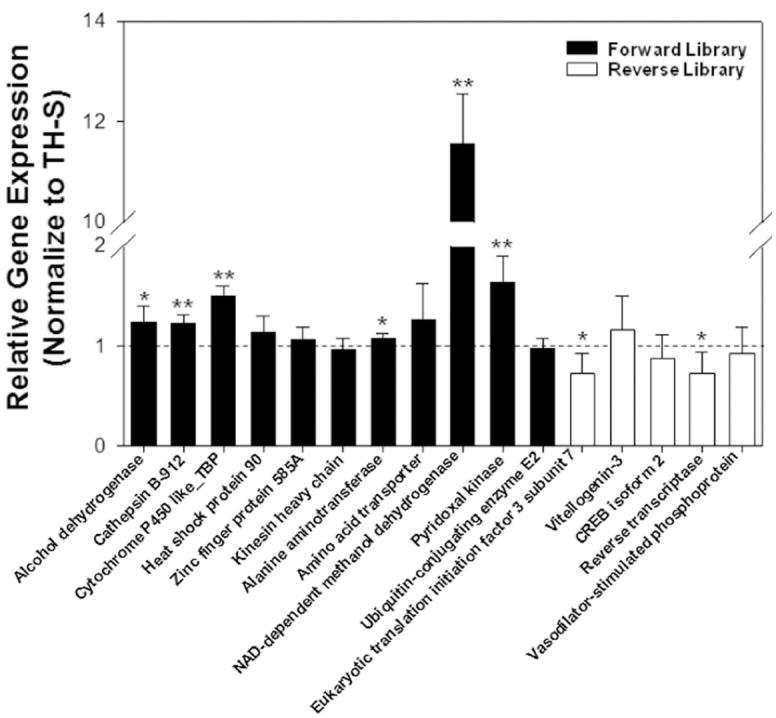
Quantitative real-time PCR validation. The gene expression level of 16 randomly selected ESTs, including 11 from SSH forward library (the black column) and five from SSH reverse library (the white column), was tested using qRT-PCR. The relative gene expression level in the resistant strains was normalized to the susceptible TH-S whiteflies. Data are presented as mean ± SE. Asterisks denote significant gene expression differences between the resistant and susceptible whiteflies, as determined by the pairwise t-tests (* p < 0.05, ** p < 0.01, LSD t-test). High quality figures are available online.